[philiptellis] /bb|[^b]{2}/
Never stop Grokking


Showing posts with label bandwidth. Show all posts

Monday, November 14, 2011

Analysing network characteristics using JavaScript and the DOM, Part I

As Web developers, we have an affinity for developing with JavaScript. Whatever the language used in the back end, JavaScript and the browser are the primary language-platform combination available at the user’s end. It has many uses, ranging from silly to experience-enhancing.

In this post, we’ll look at some methods of manipulating JavaScript to determine various network characteristics from within the browser — characteristics that were previously available only to applications that directly interface with the operating system. Much of this was discovered while building the Boomerang project to measure real user performance.

What’s In A Network Anyway?

The network has many layers, but the Web developers among us care most about HTTP, which runs over TCP and IP (otherwise known jointly as the Internet protocol suite). Several layers are below that, but for the most part, whether it runs on copper, fiber or homing pigeons does not affect the layers or the characteristics that we care about.

Network Latency

Network latency is typically the time it takes to send a signal across the network and get a response. It’s also often called roundtrip time or ping time because it’s the time reported by the ping command. While this is interesting to network engineers who are diagnosing network problems, Web developers care more about the time it takes to make an HTTP request and get a response. Therefore, we’ll define HTTP latency as the time it takes to make the smallest HTTP request possible, and to get a response with insignificant server-processing time (i.e. the only thing the server does is send a response).

Cool tip: Light and electricity travel through fiber and copper at 66% the speed of light in a vacuum, or 20 × 108 metres per second. A good approximation of network latency between points A and B is four times the time it takes light or electricity to travel the distance. Greg’s Cable Map is a good resource to find out the length and bandwidth of undersea network cables. I’ll leave it to you to put these pieces together.

Network Throughput

Network throughput tells us how well a network is being utilized. We may have a 3-megabit network connection but are effectively using only 2 megabits because the network has a lot of idle time.

DNS

DNS is a little different from everything else we care about. It works over UDP and typically happens at a layer that is transparent to JavaScript. We’ll see how best to ascertain the time it takes to do a DNS lookup.

There is, of course, much more to the network, but determining these characteristics through JavaScript in the browser gets increasingly harder.

Measuring Network Latency With JavaScript
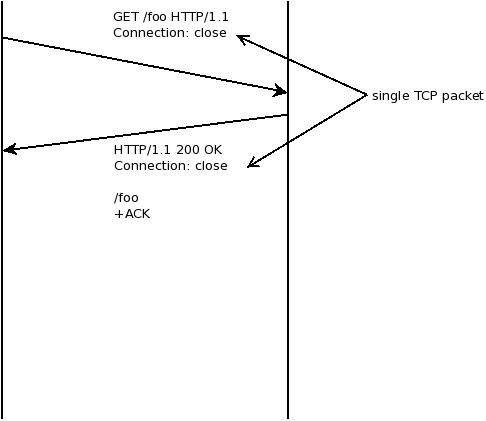
HTTP Get Request

My first instinct was that measuring latency simply entailed sending one packet each way and timing it. It’s fairly easy to do this in JavaScript:

var ts, rtt, img = new Image;
img.onload=function() { rtt=(+new Date - ts) };
ts = +new Date;
img.src="/1x1.gif";

We start a timer, then load a 1 × 1 pixel GIF and measure when its onload event fires. The GIF itself is 35 bytes in size and so fits in a single TCP packet even with HTTP headers added in.

This kinda sorta works, but has inconsistent results. In particular, the first time you load an image, it will take a little longer than subsequent loads — even if we make sure the image isn’t cached. Looking at the TCP packets that go across the network explains what’s happening, as we’ll see in the following section.

TCP Handshake and HTTP Keep-Alive
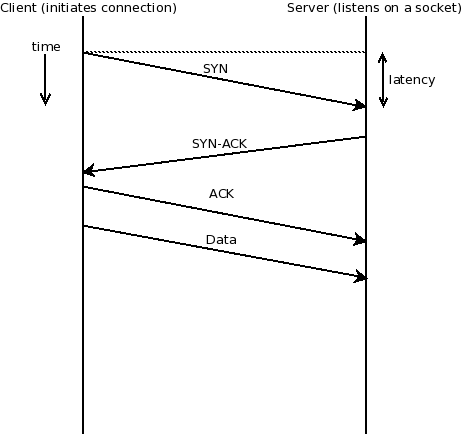
TCP handshake: SYN-ACK/SYN-ACK

When loading a Web page or image or any other Web resource, a browser opens a TCP connection to the specified Web server, and then makes an HTTP GET request over this connection. The details of the TCP connection and HTTP request are hidden from users and from Web developers as well. They are important, though, if we need to analyze the network’s characteristics.

The first time a TCP connection is opened between two hosts (the browser and the server, in our case), they need to “handshake” This takes place by sending three packets between the two hosts. The host that initiates the connection (the browser in our case) first sends a SYN packet, which kind of means, “Let’s SYNc up. I’d like to talk to you. Are you ready to talk to me?” If the other host (the server in our case) is ready, it responds with an ACK, which means, “I ACKnowledge your SYN.” And it also sends a SYN of its own, which means, “I’d like to SYNc up, too. Are you ready?” The Web browser then completes the handshake with its own ACK, and the connection is established. The connection could fail, but the process behind a connection failure is beyond the scope of this article.

Once the connection is established, it remains open until both ends decide to close it, by going through a similar handshake.

When we throw HTTP over TCP, we now have an HTTP client (typically a browser) that initiates the TCP connection and sends the first data packet (a GET request, for example). If we’re using HTTP/1.1 (which almost everyone does today), then the default will be to use HTTP keep-alive (Connection: keep-alive). This means that several HTTP requests may take place over the same TCP connection. This is good, because it means that we reduce the overhead of the handshake (three extra packets).

Now, unless we have HTTP pipelining turned on (and most browsers and servers turn it off), these requests will happen serially.
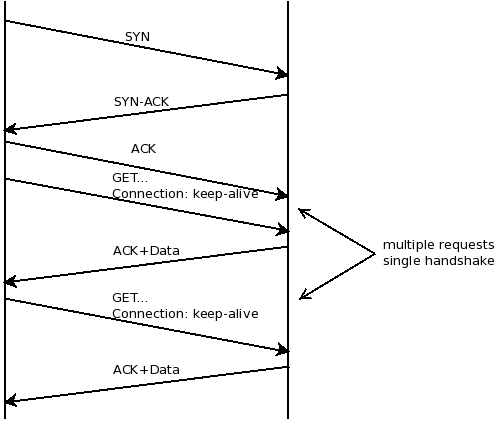
HTTP keep-alive

We can now modify our code a bit to take the time of the TCP handshake into account, and measure latency accordingly.

var t=[], n=2, tcp, rtt;
var ld = function() {
   t.push(+new Date);
   if(t.length > n) 
     done();
   else {
     var img = new Image;
     img.onload = ld;
     img.src="/1x1.gif?" + Math.random()
                         + '=' + new Date;
   }
};
var done = function() {
  rtt=t[2]-t[1];
  tcp=t[1]-t[0]-rtt;
};
ld();

With this code, we can measure both latency and the TCP handshake time. There is a chance that a TCP connection was already active and that the first request went through on that connection. In this case, the two times will be very close to each other. In all other cases, rtt, which requires two packets, should be approximately 66% of tcp, which requires three packets. Note that I say “approximately,” because network jitter and different routes at the IP layer can make two packets in the same TCP connection take different lengths of time to get through.

You’ll notice here that we’ve ignored the fact that the first image might have also required a DNS lookup. We’ll look at that in part 2.

Measuring Network Throughput With JavaScript

Again, our first instinct with this test was just to download a large image and measure how long it takes. Then size/time should tell us the throughput.

For the purpose of this code, let’s assume we have a global object called image, with details of the image’s URL and size in bits.

// Assume global object
// image={ url: "", size: "" }
var ts, rtt, bw, img = new Image;
img.onload=function() {
   rtt=(+new Date - ts);
   bw = image.size*1000/rtt;    // rtt is in ms
};
ts = +new Date;
img.src=image.url;

Once this code has completed executing, we should have the network throughput in kilobits per second stored in bw.

Unfortunately, it isn’t that simple, because of something called TCP slow-start.

Slow-Start

In order to avoid network congestion, both ends of a TCP connection will start sending data slowly and wait for an acknowledgement (an ACK packet). Remember than an ACK packet means, “I ACKnowledge what you just sent me.” Every time it receives an ACK without timing out, it assumes that the other end can operate faster and will send out more packets before waiting for the next ACK. If an ACK doesn’t come through in the expected timeframe, it assumes that the other end cannot operate fast enough and so backs off.
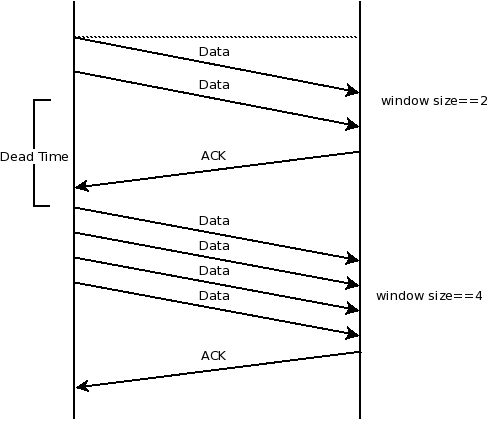
TCP window sizes for slow-start

This means that our throughput test above would have been fine as long as our image is small enough to fit within the current TCP window, which at the start is set to 2. While this is fine for slow networks, a fast network really wouldn’t be taxed by so small an image.

Instead, we’ll try by sending across images of increasing size and measuring the time each takes to download.

For the purpose of the code, the global image object is now an array with the following structure:

var image = [
	{url: ..., size: ... }
];

An array makes it easy to iterate over the list of images, and we can easily add large images to the end of the array to test faster network connections.

var i=0;
var ld = function() {
   if(i > 0)
      image[i-1].end = +new Date;
   if(i >= image.length)
      done();
   else {
      var img = new Image;
      img.onload = ld;
      image[i].start = +new Date;
      img.src=image[i].url;
   }
   i++;
};

Unfortunately, this breaks down when a very slow connection hits one of the bigger images; so, instead, we add a timeout value for each image, designed so that we hit upon common network connection speeds quickly. Details of the image sizes and timeout values are listed in this spreadsheet.

Our code now looks like this:

var i=0;
var ld = function() {
   if(i > 0) {
      image[i-1].end = +new Date;
      clearTimeout(image[i-1].timer);
   }
   if(i >= image.length ||
         (i > 0 && image[i-1].expired))
      done();
   else {
      var img = new Image;
      img.onload = ld;
      image[i].start = +new Date;
      image[i].timer =
            setTimeout(function() {
                       image[i].expired=true
                    },
                    image[i].timeout);
      img.src=image[i].url;
   }
   i++;
};

This looks much better — and works much better, too. But we’d see much variance between multiple runs. The only way to reduce the error in measurement is to run the test multiple times and take a summary value, such as the median. It’s a tradeoff between how accurate you need to be and how long you want the user to wait before the test completes. Getting network throughput to an order of magnitude is often as close as you need to be. Knowing whether the user’s connection is around 64 Kbps or 2 Mbps is useful, but determining whether it’s exactly 2048 or 2500 Kbps is much less useful.

Summary And References

That’s it for part 1 of this series. We’ve looked at how the packets that make up a Web request get through between browser and server, how this changes over time, and how we can use JavaScript and a little knowledge of statistics to make educated guesses at the characteristics of the network that we’re working with.

In the next part, we’ll look at DNS and the difference between IPv6 and IPv4 and the WebTiming API. We’d love to know what you think of this article and what you’d like to see in part 2, so let us know in a comment.

Until then, check out the references.

References

Monday, December 27, 2010

Using bandwidth to mitigate latency

[This post is mirrored from the Performance Advent Calendar]

The craft of web performance has come a long way from yslow and the first few performance best practices. Engineers the web over have made the web faster and we have newer tools, many more guidelines, much better browser support and a few dirty tricks to make our users' browsing experience as smooth and fast as possible. So how much further can we go?

Physics

The speed of light has a fixed upper limit, though depending on the medium it passes through, it might be lower. In fibre, this is about 200,000 Km/s, and it's about the same for electricity through copper. This means that a signal sent over a cable that runs 7,000Km from New York to the UK would take about 35ms to get through. Channel capacity (the bit rate), is also limited by physics, and it's Shannon's Law that comes into play here.

This, of course, is the physical layer of our network. We have a few layers above that before we get to TCP, which does most of the dirty work to make sure that all the data that your application sends out actually gets to your client in the right order. And this is where it gets interesting.

TCP

Éric Daspet's article on latency includes an excellent discussion of how slow start and congestion control affect the throughput of a network connection, which is why google have been experimenting with an increased TCP initial window size and want to turn it into a standard. Each network roundtrip is limited by how long it takes photons or electrons to get through, and anything we can do to reduce the number of roundtrips should reduce total page download time, right? Well, it may not be that simple. We only really care about roundtrips that run end-to-end. Those that run in parallel need to be paid for only once.

When thinking about latency, we should remember that this is not a problem that has shown up in the last 4 or 5 years, or even with the creation of the Internet. Latency has been a problem whenever signals have had to be transmitted over a distance. Whether it is a rider on a horse, a signal fire (which incidentally has lower latency than light through fibre[1]), a carrier pigeon or electrons running through metal, each has had its own problems with latency, and these are solved problems.

C-P-P

There are three primary ways to mitigate latency. Cache, parallelise and predict[2]. Caching reduces latency by bringing data as close as possible to where it's needed. We have multiple levels of cache including the browser's cache, ISP cache, a CDN and front-facing reverse proxies, and anyone interested in web performance already makes good use of these. Prediction is something that's gaining popularity, and Stoyan has written a lot about it. By pre-fetching expected content, we mitigate the effect of latency by paying for it in advance. Parallelism is what I'm interested in at the moment.

Multi-lane highways

Mike Belshe's research shows that bandwidth doesn't matter much, but what interests me most is that we aren't exploiting all of this unused channel capacity. Newer browsers do a pretty good job of downloading resources in parallel, and with a few exceptions (I'm looking at you Opera), can download all kinds of resources in parallel with each other. This is a huge change from just 4 years ago. However, are we, as web page developers, building pages that can take advantage of this parallelism? Is it possible for us to determine the best combination of resources on our page to reduce the effects of network latency? We've spent a lot of time, and done a good job combining our JavaScript, CSS and decorative images into individual files, but is that really the best solution for all kinds of browsers and network connections? Can we mathematically determine the best page layout for a given browser and network characteristics[3]?

Splitting the combinative

HTTP Pipelining could improve throughput, but given that most HTTP proxies have broken support for pipelining, it could also result in broken user experiences. Can we parallelise by using the network the way it works today? For a high capacity network channel with low throughput due to latency, perhaps it makes better sense to open multiple TCP connections and download more resources in parallel. For example, consider these two pages I've created using Cuzillion:
  1. Single JavaScript that takes 8 seconds to load
  2. 4 JavaScript files that take between 1 and 3 seconds each to load for a combined 8 second load time.
Have a look at the page downloads using FireBug's Net Panel to see what's actually happening. In all modern browsers other than Opera, the second page should load faster whereas in older browsers and in Opera 10, the first page should load faster.

Instead of combining JavaScript and CSS, split them into multiple files. How many depends on the browser and network characteristics. The number of parallel connections could start of based on the ratio of capacity to throughput and would reduce as network utilisation improved through larger window sizes over persistent connections. We're still using only one domain name, so no additional DNS lookup needs to be done. The only unknown is the channel capacity, but based on the source IP address and a geo lookup[4] or subnet to ISP map, we could make a good guess. Boomerang already measures latency and throughput of a network connection, and the data gathered can be used to make statistically sound guesses.

I'm not sure if there will be any improvements or if the work required to determine the optimal page organisation will be worth it, but I do think it's worth more study. What do you think?

Footnotes

  1. Signal fires (or even smoke signals) travel at the speed of light in air v/s light through fibre, however the switching time for signal fires is far slower, and you're limited to line of sight.
  2. David A. Patterson. 2004. Latency lags bandwith[PDF]. Commun. ACM 47, 10 (October 2004), 71-75.
  3. I've previously written about my preliminary thoughts on the mathematical model.
  4. CableMap.info has good data on the capacity and latency of various backbone cables.

Wednesday, August 25, 2010

An equation to predict a page's roundtrip time


Note that I'm using MathJax to render the equations on this post. It can take a while to render everything, so you may need to wait a bit before everything shows up. If you're reading this in a feed reader, then it will all look like gibberish (or LaTeX if you can tell the difference).

So I've been playing with this idea for a while now, and bounced it off YSlow dev Antonia Kwok a few times, and we came up with something that might work. The question was whether we could estimate a page's expected roundtrip time for a particular user just by looking at the page structure. The answer, is much longer than that, but tends towards possibly.

Let's break the problem down first. There are two large unknowns in there:
  • a particular user
  • the page's structure
These can be broken down into their atomic components, each of which is either known or measurable:
  • Network characteristics:
    • Bandwidth to the origin server ( \(B_O\) )
    • Bandwidth to your CDN ( \(B_C\) )
    • Latency to the origin server ( \(L_O\) )
    • Latency to your CDN ( \(L_C\) )
    • DNS latency to their local DNS server ( \(L_D\) )
  • Browser characteristics:
    • Number of parallel connections to a host ( \(N_{Hmax}\) )
    • Number of parallel connections overall ( \(N_{max}\) )
    • Number of DNS lookups it can do in parallel ( \(N_{Dmax}\) )
    • Ability to download scripts in parallel
    • Ability to download css in parallel (with each other and with scripts)
    • Ability to download images in parallel with scripts
  • Page characteristics:
    • Document size (\(S_O\) )
    • Size of each script (\(S_{S_i}\))
    • Size of each non-script resource (images, css, etc.) (\(S_{R_i}\))
    • Number of scripts ( \(N_S\))
    • Number of non-script resources (\(N_R\))
    • Number of hostnames (\(N_H\)), further broken down into:
      • Number of script hostnames (\(N_{SH}\))
      • Number of non-script hostnames (\(N_{RH}\))
All sizes are on the wire, so if a resource is sent across compressed, we consider the compressed size and not the uncompressed size. Additionally, scripts and resources within the page can be combined into groups based on the parallelisation factor of the browser in question. We use the terms \(SG_i\) and \(RG_i\) to identiffy these groups. We treat scripts and non-script resources differently because browsers treat them differently, ie, some browsers will not download scripts in parallel even if they download other resources in parallel.

To simplify the equation a bit, we assume that bandwidth and network latency from the user to the CDN and the origin are the same. Additionally, the latency for the main page includes both network latency and the time it takes the server to generate the page (\(L_S\)). Often this time can be significant, so we redefine the terms slightly:
\begin{align}
B_O & = B_C \\
L_O & = L_S + L_C
\end{align}

Browser characteristics are easy enough to obtain. Simply pull the data from BrowserScope's Network tab. It contains almost all the information we need. The only parameter not listed is the number of parallel DNS lookups that a browser can make. Since it's better to err on the side of caution, we assume that this number is 1, so for all further equations, assume \(N_{Dmax} = 1\).

Before I get to the equation, I should mention a few caveats. It's fairly naïve, assuming that all resources that can be downloaded in parallel will be downloaded in parallel, that there's no blank time between downloads, and that the measured bandwidth \(B_C\) is less than the actual channel capacity, therefore multiple parallel TCP connections will all have access to the full bandwidth. This is not entirely untrue for high bandwidth users, but it does breakdown when we get down to dial-up speeds. Here's the equation:
\[
T_{RT} = T_P + T_D + T_S + T_R
\]
Where:
\begin{align}
T_P \quad & = \quad L_O + \frac{S_O}{B_C}\\
\\
\\
\\
\\
\\
T_D \quad & = \quad \frac{N_H}{N_{Dmax}} \times L_D\\
\\
\\
\\
\\
\\
T_S \quad & = \quad \sum_{i=1}^{N_{SG}} \left( \frac{S_{SG_imax}}{B_C} + L_C \right) \\
\\
\\
\\
\\
\\
N_{SG} \quad & = \quad \left\{
\begin{array}{1 1}
\frac{N_S}{min \left( N_{Hmax} \times N_{SH}, N_{max} \right) } & \quad \text{if browser supports parallel scripts}\\
\\
\\
N_S & \quad \text{if browser does not support parallel scripts}\\
\end{array} \right. \\
\\
\\
\\
\\
\\
S_{SG_imax} \quad & = \quad \text{Size of the largest script in script group } SG_i\\
\\
\\
\\
\\
\\
T_R \quad & = \quad \sum_{i=1}^{N_{RG}} \left( \frac{S_{RG_imax}}{B_C} + L_C \right) \\
\\
\\
\\
\\
\\
N_{RG} \quad & = \quad \frac{N_R}{min \left( N_{Hmax} \times N_{RH}, N_{max} \right) }\\
\\
\\
\\
\\
\\
S_{RG_imax} \quad & = \quad \text{Size of the largest resource in resource group } RG_i
\end{align}

So this is how it works...

We assume that the main page's download time is a linear function of its size, bandwidth, the time it takes for the server to build the page and the network latency between the user and the server. While this is not correct (consider multiple flushes, bursty networks, and other factors), it is close.

We then consider all scripts in groups based on whether the browser can handle parallel script downloads or not. Script groups are populated based on the following algorithm:
for each script:
   if size of group > Nmax:
      process and empty group
   else if number of scripts in group for a given host > NHmax:
      ignore script for the current group, reconsider for next group
   else
      add script to group

process and empty group
If a browser cannot handle parallel scripts, then we just temporarily set \(N_{max}\) to 1.

Similarly, we consider the case for all non-script resources:
for each resource:
   if size of group > Nmax:
      process and empty group
   else if number of resources in group for a given host > NHmax:
      ignore resource for the current group, reconsider for next group
   else
      add resource to group

process and empty group

For DNS, we assume that all DNS lookups are done sequentially. This makes our equation fairly simple, but turns our result into an overestimate.

Overall, this gives us a fairly good guess at what the roundtrip time for the page would be, but it only works well for high bandwidth values.

We go wrong with our assumptions at a few places. For example, we don't consider the fact that resources may download in parallel with the page itself, or that when the smallest script/resource in a group has been downloaded, the browser can start downloading the next script/resource. We ignore the fact that some browsers can download scripts and resources in parallel, and we assume that the browser takes no time to actually execute scripts and render the page. These assumptions introduce an error into our calculations, however, we can overcome them in the lab. Since the primary purpose of this experiment is to determine the roundtrip time of a page without actually pushing it out to users, this isn't a bad thing.

So, where do we get our numbers from?

All browser characteristics come from BrowserScope.

The user's bandwidth is variable, so we leave that as a variable to be filled in by the developer running the test. We could simply select 5 or 6 bandwidth values that best represent our users based on the numbers we get from boomerang. Again, since this equation breaks down at low bandwidth values, we could simply ignore those.

The latency to our CDN is something we can either pull out of data that we've already gathered from boomerang, or something we can calculate with a simple and not terribly incorrect formula:
\[
L_C = 4 \times \frac{distance\left(U \leftrightarrow C\right)}{c_{fiber}}
\]
Where \(c_{fiber}\) is the speed of light in fiber, which is approximately \(2 \times 10^8 m/s\).

DNS latency is a tough number, but since most people are fairly close to their ISPs, we can assume that this number is between 40-80ms. The worst case is much higher than that, but on average, this should be correct.

The last number we need is \(L_S\), the time it takes for the server to generate the page. This is something that we can determine just by hitting our server from a nearby box, which is pretty much what we do during development. This brings us to the tool we use to do all the calculations.

YSlow already analyses a page's structure and looks at the time it takes to download each resource. We just pull the time out from what YSlow already has. YSlow also knows the size of all resources (both compressed and uncompressed), how many domains are in use and more. By sticking these calculations into YSlow, we could get a number that a developer can use during page development.

The number may not be spot on with what real users experience, but a developer should be able to compare two page designs and determine which of these will perform better even if they get the same YSlow score.

Naturally this isn't the end of the story. We've been going back and forth on this some more, and are tending towards more of a CPM approach to the problem. I'll write more about that when we've sorted it out.

For now, leave a comment letting me know what you think. Am I way off? Do I have the right idea? Can this be improved upon? Is this something you'd like to see in YSlow?

Friday, April 09, 2010

Analysis of the bandwidth and latency of YUIblog readers

A few months ago, Eric Miraglia from the YUI team helped me run some analysis on the types of network connections that were coming in to YUIBlog. In this article on the YUI blog, I've published the results of my analysis.

Please leave comments on the YUIblog.

Tuesday, January 19, 2010

Bandwidth test v1.2

After testing this out for about a week, I'm ready to release v1.2 of the bandwidth testing code.

Get the ZIP file or Try it online

Changes

The changes in this release are all statistical, and related to the data I've collected while running the test.
  1. Switch from the geometric mean to the arithmetic mean, because data for a single user is more or less centrally clustered.

    This is not true across users, but for readings for a single user (single connection actually), I've found that the data does not really have outliers.
  2. Instead of downloading all images on every run, use the first run as a pilot test, and based on the results from that run, only download the 3 largest images that can be downloaded for this user.

    This allows us to download fewer bytes, and get more consistent results across runs.
  3. Add random sampling. In previous versions, the test would be run for every page view. By adding random sampling, we now only run it on a percentage of page views.

    You can now set PERFORMANCE.BWTest.sample to a number between 0 and 100, and that's the percentage of page views that will be tested for bandwidth. Note that this is not an integer, so you can set it to 0.1 or 10.25, or anything as long as it's between 0 and 100 (both inclusive). Setting it to 0 means that the test isn't run for anyone, so you probably don't want that, and 100 means that the test is run for everybody. This is also the default.
  4. Fire an onload event when the script completes loading. This is mainly so that you can asynchronously load the script so that it does not affect your page load time. Instead of checking for script.onload or onreadystatechange, you can just implement the PERFORMANCE.BWTest.onload method.
You can see the entire history on github.

Sunday, January 10, 2010

Bandwidth test v1.1

I've just bumped the version number on the bandwidth test to 1.1. There were two major changes that I'll describe below.

Get the ZIP file or Try it online

Changes

The changes in this release were both detected when testing via mobile phones, but they should improve the test's reliability for users of all (javascript enabled) browsers.
  1. I noticed that on the Nokia E71, the latency test wasn't running. After much debugging (this browser doesn't have a firebug equivalent), it turned out that the browser will not fire any events on an image object if the HTTP response's content length is 0.

    Since I was using a 0 byte file named image-l.png, this file's content-type was set to image/png, but its content-length was 0. Most browsers fired the onerror event when this happened, but Nokia's browser which is based on AppleWebKit/413 fires nothing. I then changed the image to return a 204 No Content HTTP response code, but I had the same problem. The only solution was to send some content. After playing around with several formats, I found that GIF could generate the smallest image of all at 35 bytes, so I used that. I haven't noticed any change in latency results on my desktop browser after the change, so I think it should be okay.

    This also means that browsers will now fire the onload event instead of onerror, so I changed that code as well.
  2. The second change fixes a bug in the code related to timed out images. This is what was happening.

    A browser downloads images of progressively larger size until it hits an image that takes more than 3 seconds to download. When this happens, it aborts the run, and moves on to the next run, or to the latency test.

    The bug was that even though the javascript thought it was aborting the run, the browser did not stop the download, even after setting the image object to null. As a result of this, the next run, or the latency check was running in parallel with this big download. In some cases, this meant that the next run would be slower than it should have been, but in other cases, it meant that the images for the next run would block and not be downloaded until this big image completed. The result of this was that those other images would also time out, making the problem worse.

    For the latency check, this meant that the image would never download, and that's why latency would show up as NaN -- I was trying to get the median of an empty array.

    I fixed this by changing the timeout logic a bit. Now a timeout does not abort the run, it only sets an end of run flag. Once the currently downloading image completes, successfully or not, the handler sees the flag, and terminates the run at that point. There are two benefits to this. The first is that this bug is fixed. The second is that we can now reduce the overall timeout since we are guaranteed to have at least one image load. So, the test should now complete faster.
  3. A third minor change I made was in the timeout values for each image. I've increased it a little for the small images so that the test still works on really slow connections -- like AT&T's 2G network, which gives me about 30-40kbps
All together, this should provide a more reliable test for everyone, and a test that actually works on mobile phones.

Thanks

I'd like to thank all my friends who tested this with their iPhones - that's where the timeout+parallel downloads bug was most visible, and there is no way I'd have fixed it without your help. Stay tuned for more posts on what I've learnt from it all.

So, go get the code, run your own tests, read my source code, challenge my ideas. If you think something isn't done correctly, let me know, or even better, send in a patch. The code is on github.

Short URL: http://tr.im/jsbwtest11

Saturday, January 02, 2010

Run your own bandwidth test

Happy 2010 to all my readers. A new post to start off this year. Back in November, I wrote about bandwidth testing through javascript. I've just created a github project for it, and am making the code available for anyone to download and use on their own servers. Use this if you want to know what your site's users' bandwidth is, and perhaps customise the experience for different bandwidths.

Get the ZIP file
(updated to 1.1)

The zip file contains:
  • bw-test.js: the javascript file you need
  • image-*.png: bandwidth testing images
  • README: brief instructions
  • tests/*.html: simple tests that show you how to use the code
Unzip the file into a directory in your web root. You really only need the javascript and the images, so you can get rid of the rest. The javascript does not need to be in the same directory as the images, just make sure the base_url variable points to the URL where the images are. This means that you can offload the javascript onto a CDN and keep the images on your own server. You shouldn't push the images to a CDN, because that will measure your user's effective bandwidth when accessing the CDN and not your server, which is presumably what you'd like to know. You'd probably also want to minify the javascript before using it. I'll provide a minified version in a later release.

The test runs automatically once the code is included, so to avoid interfering with the download of your page's components, make sure it's the last thing on your page.

If you want to get a little more adventurous, you could set the auto_run variable to false, and then start the test whenever you're ready to run it by calling PERFORMANCE.BWTest.run().

Once the test completes, it will fire the PERFORMANCE.BWTest.oncomplete event. You can attach your own function to this event to do what you want with the results. You can also beacon back the results to your server by setting the beacon_url variable. This URL will be called with the following URL parameters:
  • bw: The median bandwidth in bytes/second
  • latency: The median HTTP latency in milliseconds
  • bwg: The geometric mean of bandwidth measurements in bytes/second
  • latencyg: The geometric mean of HTTP latency measurements in milliseconds
Your script that handles this URL may store these details in a database keyed on the user's IP or at least some part of it, and perhaps set a cookie to avoid running the test if you already know their bandwidth.

The code is distributed under the BSD license, so use it as you like.

Note that all variables mentioned above are in the PERFORMANCE.BWTest namespace.

Tuesday, November 24, 2009

Measuring a user's bandwidth

In my last post about performance, I spoke about measurement. Over the last few days I've been looking at bandwidth measurement. These ideas have been floating around for years and we've tested some before at Yahoo!, but I wanted to try a few new things.

Try it out now.


The concept is actually quite simple.
  1. Try to download multiple images with progressively increasing sizes
  2. Set a reasonable timeout for the images to download
  3. Stop at the first one that times out - that means that we have enough data to make an estimation.
  4. Calculate the bandwidth by dividing each image's size by the time it took to download.
I run this test a few times, and then run some statistical analysis on the data gathered. The analysis is pretty basic. I first pull out the geometric mean of the data, then sort the data, run IQR filtering on it, and then pull out the median point. I use the geometric mean as well as the post IQR filtered median because I'm not sure at this point which is more resilient to temporary changes in network performance. This data is then stored in a database along with the user's IP address and the current timestamp.

I also try to measure latency. This is not network latency, but server latency from the user's point of view, ie, how long does it take between request and first byte of response. I run this test multiple times and do the same kind of stats on this data.

The goal of this test

The few people I've shown this to all had the same question. What's the goal of this test? There are already several free bandwidth testers available that one can use to determine ones bandwidth, so what does this do differently.

The way I see it, as a site owner, I don't really care about the bandwidth that my users have with their ISPs - unless of course, I have my servers in the ISP's data centre. I really care about the bandwidth that user's experience when visiting my website. This test aims to measure that. Ideally, this piece of code can be put into any web page to measure the user's bandwidth in the background while he's interacting with your site. I don't know how it will work in practice though.

Insights from the data

I don't really know. It could be useful to figure out what users from different geographical locations experience. Same with ISPs. It might also just tell me that dreamhost is a really bad hosting provider.

Data consistency

In my repeated tests, I've found that the data isn't really consistent. It's not all over the place, but it fluctuates a fair bit. I've seen different levels of consistency when using the geometric mean and the median, but I don't think I have enough data yet to decide which is more stable. This could mean that my server just responds differently to multiple requests or it could mean many other things. I don't really know, but feel free to leave a comment if you do.

Credits

I don't know who first came up with the idea of downloading multiple images to test bandwdith, but it wasn't my idea. The latency test idea came from Tahir Hashmi and some insights came from Stoyan Stefanov.

Once again, here's the link.

Short URL: http://tr.im/bwmeasure

...===...