![[philiptellis]](https://en.gravatar.com/userimage/3079306/f13167d69aa4e1cb5e5f131af4e38e3e.jpeg)
A recent tweet by Punit Sethi about a Wordpress plugin that reduces Largest Contentful Paint (LCP) without actually improving user experience led to a discussion about faking/gaming metrics.
Core Web Vitals
Google recently started using the LCP and other Core Web Vitals (aka CWV) as a signal for ranking search results. Google's goal in using CWV as a ranking signal is to make the web better for end users. The understanding is that these metrics (Input delays, Layout shift, and Contentful paints) reflect the end user experience, so sites with good CWV scores should (in theory) be better for users... reducing wait time, frustration, and annoyance with the web.
If I've learnt anything over the last 20 years of working with the web, it's that getting to the top of a Google search result page (SRP) is a major goal for most site owners, so metrics that affect that ranking tend to be researched a lot. The LCP is no different, and the result often shows up in such "quick fix" plugins that Punit discusses above. Web performance (Page Load Time) was only ever spoken about as a sub-topic in highly technical spaces until Google decided to start using it as a signal for page ranking, and then suddenly everyone wanted to make their sites faster.
My background in performance
I started working with web performance in the mid 2000s at Yahoo!. We had amazing Frontend Engineering experts at Yahoo!, and for the first time, engineering processes on the front-end were as strong as the back-end. In many cases we had to be far more disciplined, because Frontend Engineers do not have the luxury of their code being private and running on pre-selected hardware and software specs.
At the time, Yahoo! had a performance team of one person — Steve "Chief Performance Yahoo" Souders. He'd gotten a small piece of JavaScript to measure front-end performance onto the header of all pages by pretending it was an "Ad", and Ash Patel, who may have been an SVP at the time, started holding teams accountable for their performance.
Denial
Most sites' first reaction was to deny the results, showing scans from Keynote and Gomez, which at the time only synthetically measured load times from the perspective of well connected backbone agents, and were very far off from the numbers that roundtrip was showing.
The Wall of Shame
I wasn't working on any public facing properties, but became interested in Steve's work when he introduced the Wall of Fame/Shame (depending on which way you sorted it). It would periodically show up on the big screen at URLs (the Yahoo! cafeteria). Steve now had a team of 3 or 4, and somehow in late 2007 I managed to get myself transferred into this team.
The Wall of Shame showed a kind of stock-ticker like view where a site's current performance was compared against its performance from a week ago, and one day we saw a couple of sites (I won't mention them) jump from the worst position to the best! We quickly visited the sites and timed things with a stop-watch, but they didn't actually appear much faster. In many instances they might have even been slower. We started looking through the source and saw what was happening.
The sites had discovered AJAX!
Faking it
There was almost nothing loaded on the page before the onload event. The only content was some JavaScript that ran on onload and downloaded the framework and data for the rest of the site. Once loaded, it was a long-lived single page application with far fewer traditional page views.
Site owners argued that it would make the overall experience better, and they weren't intentionally trying to fake things. Unfortunately we had no way to actually measure this, so we added a way for them to call an API when their initial framework had completed loading. That way we'd get some data to trend over time.
At Yahoo! we had the option of speaking to every site builder and to work with them to make things better. Outside though, is a different matter.
Measuring Business Impact
Once we'd started LogNormal (and continuing with mPulse), and were serving multiple customers, it soon became clear that we'd need both business and engineering champions at each customer site. We needed to sell the business case for performance, but also make sure engineering used it for their benefit rather than gaming the metrics. We started correlating business metrics like revenue, conversions, and activity with performance. There is no cheap way to game these metrics because they depend on the behaviour of real users.
Sites that truly care about performance and the business impact of that performance, worked hard to make their sites faster.
This changed when Google started using speed as a ranking signal.
With this change, sites now had to serve two users, and when in conflict, Real Users lost out to Googlebot. After all, you can't serve real users if they can't see your site. Switching to CWV does not change the situation because things like Page Load Time, Largest Contentful Paint, and Layout Shift can all be faked or gamed by clever developers.
Ungameable Metrics
This brings us back to the metrics that we've seen couldn't be gamed. Things like time spent on a site, bounce rate, conversions, and revenue, are an indication of actual user behaviour. Users are only motivated by their ability to complete the task they set out to do, and using this as a ranking signal is probably a better idea.
Unfortunately, activity, conversions, and revenue are also fairly private corporate data. Leaking this data can affect stock prices and clue competitors in to how you're doing.
User frustration & CrUX
Now the goal of using these signals is to measure user frustration. Google Chrome periodically sends user interaction measurements back to their servers, collected as part of the Chrome User Experience report (CrUX). This includes things like the actual user experienced LCP, FID, and CLS In my opinion, it should also include measures like rage clicks, missed, and dead clicks, jank while scrolling, CPU busy-ness, battery drain, etc. Metrics that only come into play while a user is interacting with the site, and that affect or reflect how frustrating the experience may be.
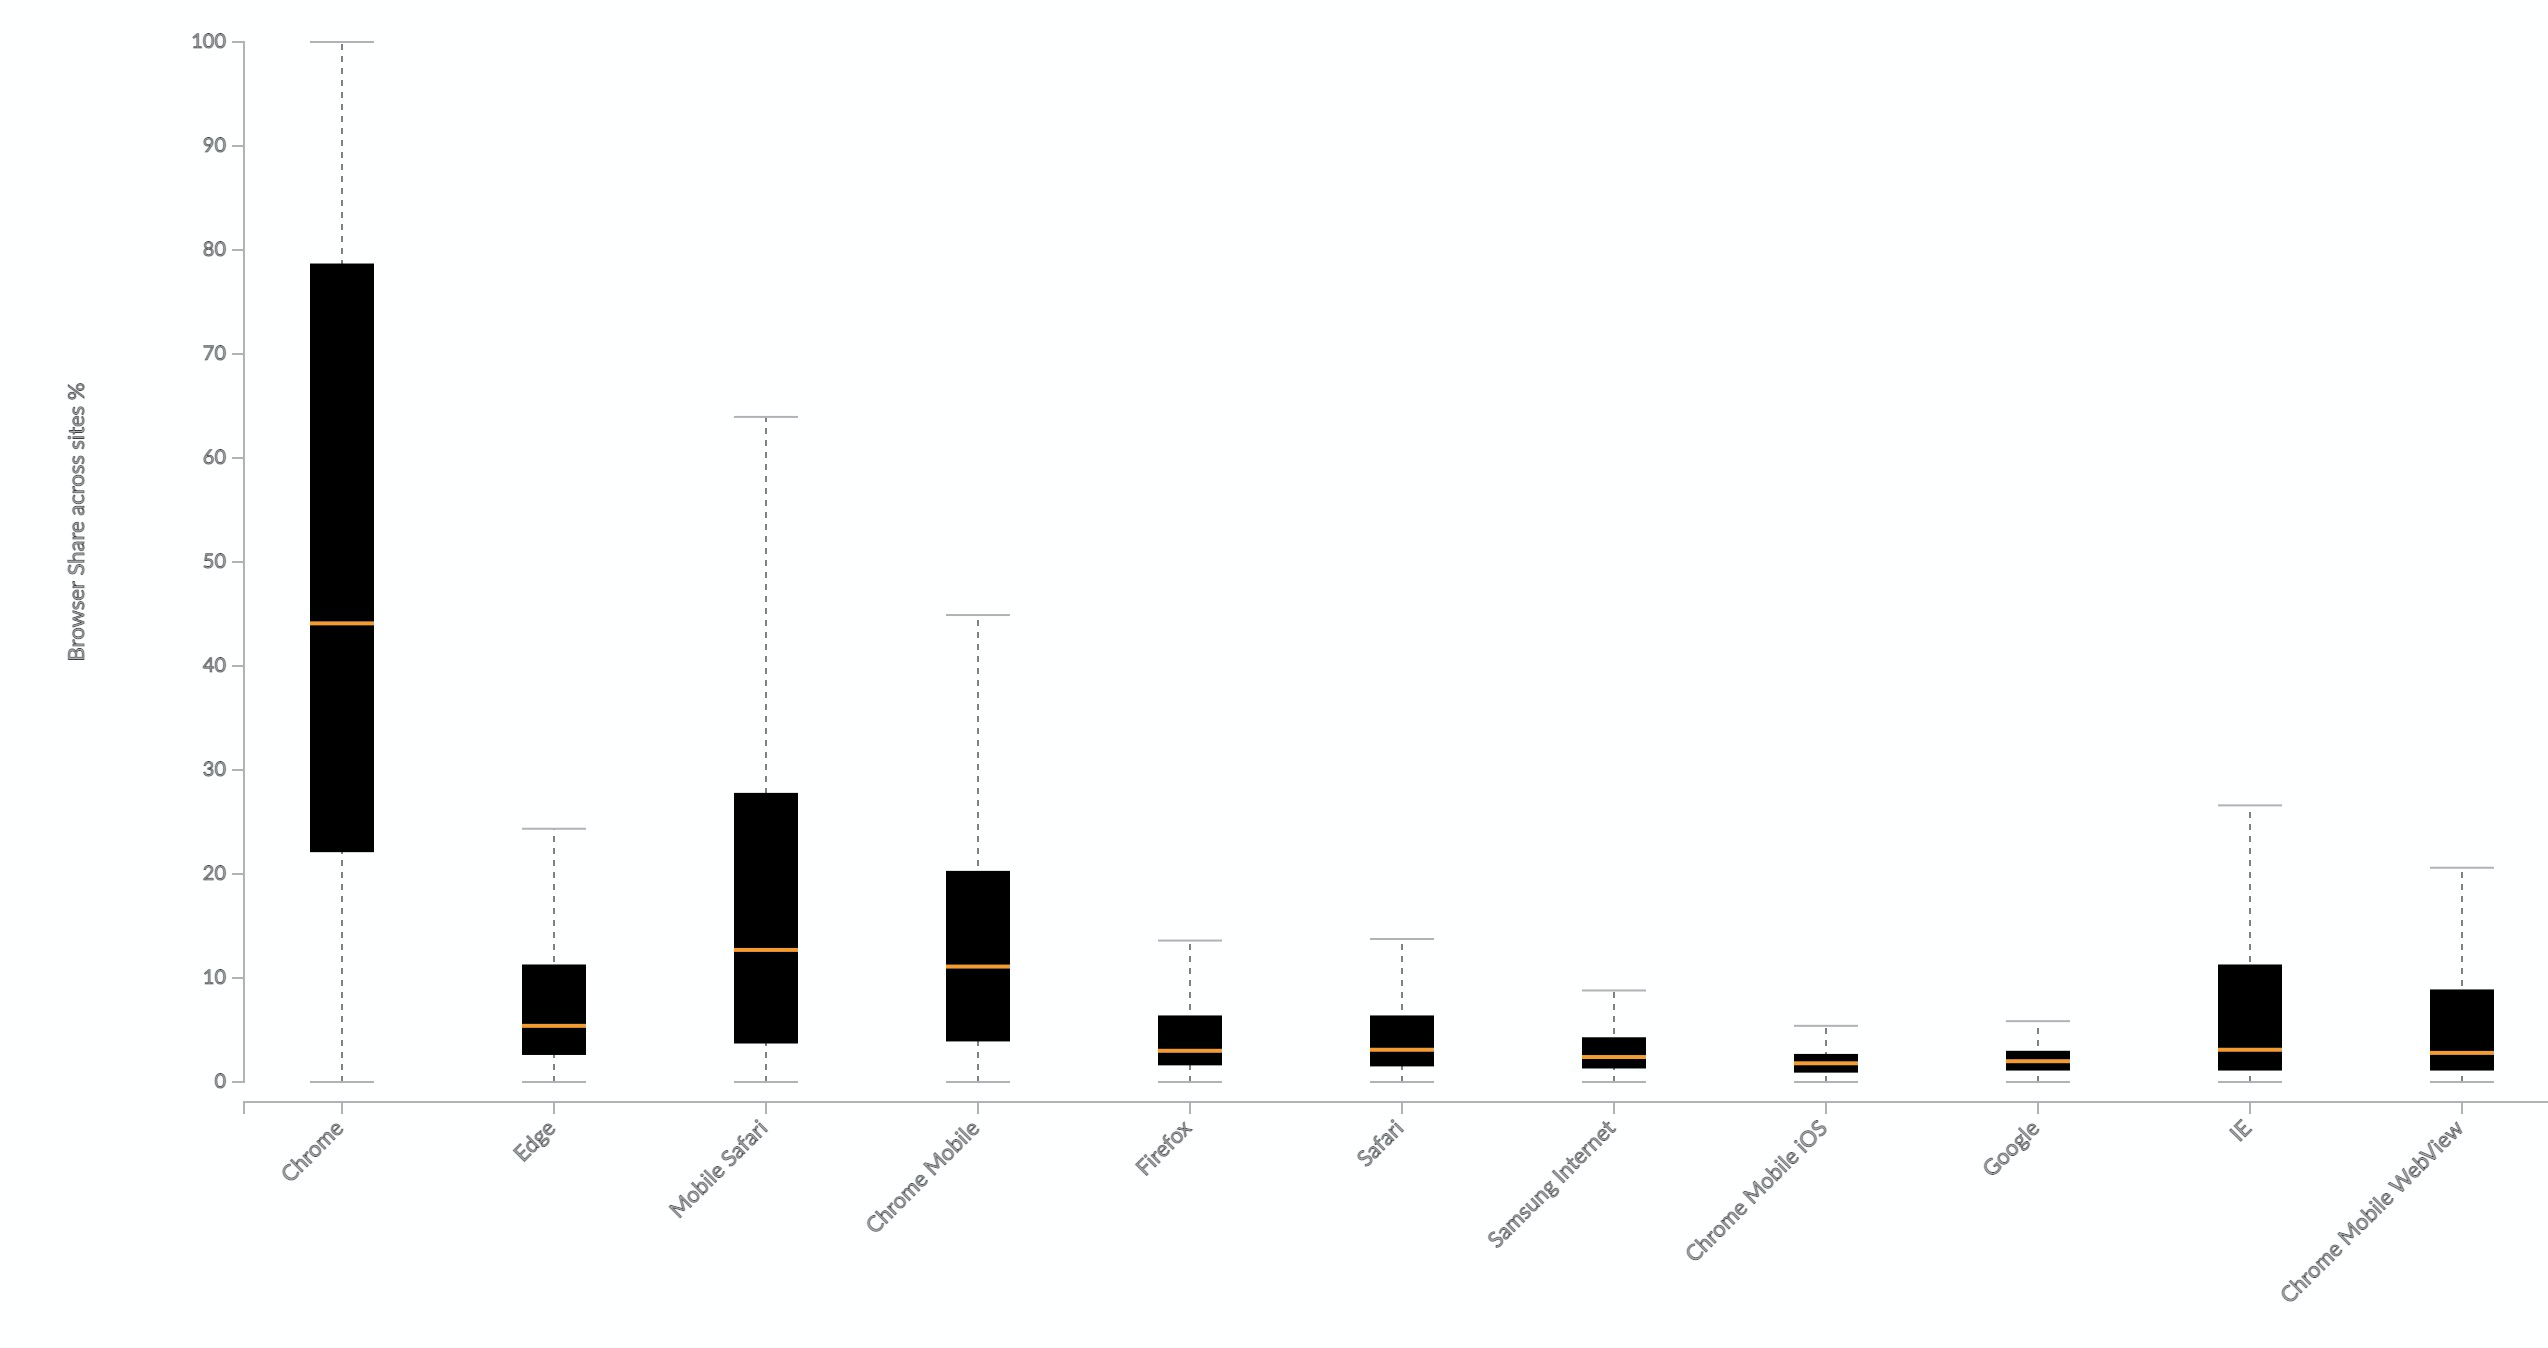
It would also need to have buy-in from a few more browsers. Chrome has huge market share, but doesn't reflect the experience of all users. Data from mPulse shows that across websites, Chrome only makes up, on average, 44% of page loads. Edge and Safari (including mobile) also have a sizeable share. Heck, even IE has a 3% share on sites where it's still supported.
In the chart below, each box shows the distribution of a browser's traffic share across sites. The plot includes (in descending order of number of websites with sizeable traffic for that browser) Chrome, Edge, Mobile Safari, Chrome Mobile, Firefox, Safari, Samsung Internet, Chrome Mobile iOS, Google, IE, and Chrome Mobile WebView.
It's unlikely that other browsers would trust Google with this raw information, so there probably needs to be an independent consortium that collects, anonymizes, and summarizes the data, and makes it available to any search provider.
Using something like the Frustration Index is another way to make it hard to fake ranking metrics without also accidentally making the user experience better.
Comparing these metrics with Googlebot's measures could hint at whether the metrics are being gamed or not, or perhaps it even lowers the weight of Googlebot's measures, restricting it only to pages that haven't received a critical mass of users.
We need to move the balance of ranking power back to the users whose experience matters!

0 comments :
Post a Comment